

Why this topic matters
This topic matters because it helps farmers, advisors and field teams understand a signal before turning it into an operational decision. The goal is simple: read the context, compare it with field reality and decide what deserves attention.
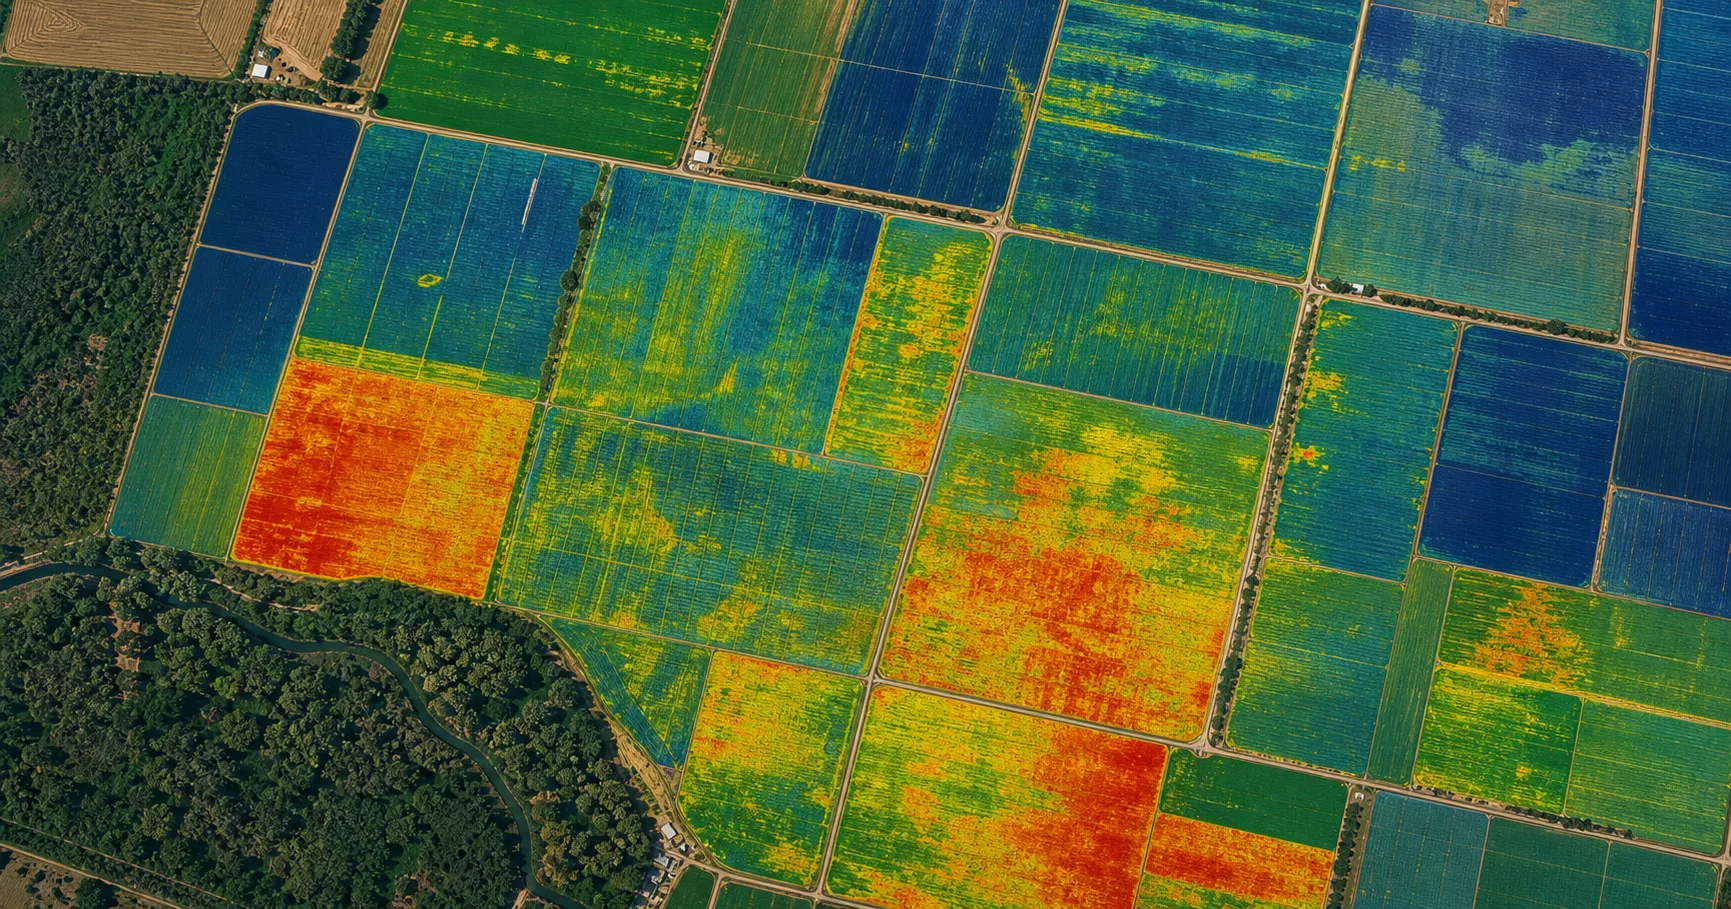
What thermal maps, canopy temperature, LST, anomalies and water stress signals contribute to crop monitoring. In practical terms, thermal indices should be read as context for better decisions, not as a diagnosis by itself. They show temperature differences that may appear before visual stress is obvious.
What the user should look at
| Signal | What it helps interpret |
|---|---|
| land surface temperature | They show temperature differences that may appear before visual stress is obvious. |
| canopy temperature | They show temperature differences that may appear before visual stress is obvious. |
| thermal anomaly | They show temperature differences that may appear before visual stress is obvious. |
| CWSI or water stress signal | They show temperature differences that may appear before visual stress is obvious. |
| comparison with NDMI and irrigation | They show temperature differences that may appear before visual stress is obvious. |
How to interpret it without overclaiming
The safest interpretation is comparative: look at the same field over time, compare similar zones, and validate the hypothesis in the field before turning a map into an instruction.
| Field question | Why it matters |
|---|---|
| Is the hot zone persistent? | They show temperature differences that may appear before visual stress is obvious. |
| Is vegetation cover comparable? | They show temperature differences that may appear before visual stress is obvious. |
| Did irrigation or rain happen recently? | They show temperature differences that may appear before visual stress is obvious. |
A practical workflow
- Identify the parcel and crop stage.
- Review the most recent map or operational record.
- Compare with previous dates and recent work.
- Check weather, irrigation, inventory or field observations.
- Create an inspection or task only when the signal is relevant.
- Close the loop with photos, notes and a decision.
Common mistakes
- Do not treat one color or one value as a diagnosis.
- Do not compare different crops without context.
- Do not ignore sensor limits, timing or data quality.
- Do not turn a signal into an automatic treatment.
- Always keep agronomic judgment and local validation in the loop.
In summary
Thermal indices in agriculture: crop temperature, heat stress and irrigation is most useful when it helps the team ask better questions, prioritize field checks and document what was found. The public value is interpretation: understand the signal, compare it with context, and confirm the decision in the field.